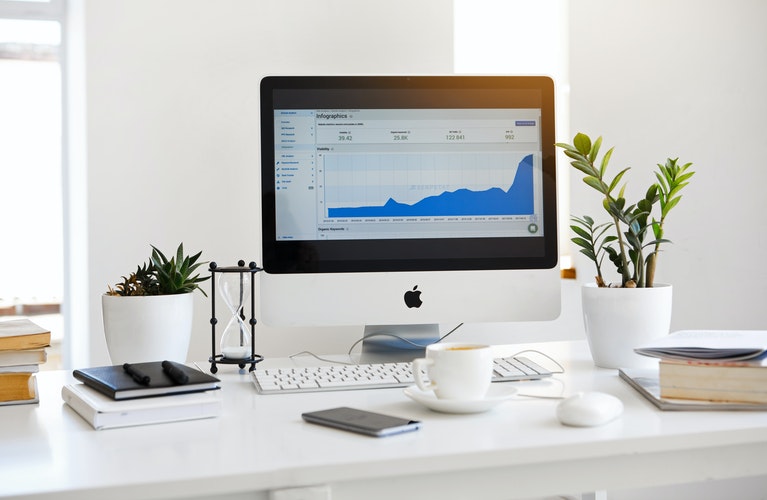
Automated chart scanning has changed the way traders find potential market opportunities. Instead of manually checking dozens of charts, traders can use software to scan price data and identify technical patterns based on predefined conditions. This approach can save time, reduce repetitive work, and help traders organize market information more efficiently.
A modern Chart scanner for multiple markets can monitor several assets, timeframes, and markets from one interface. Whether you follow forex, cryptocurrencies, stocks, or other financial instruments, automated scanning can help you focus on charts that match your selected criteria.
Tools such as Fibonacci Scanner can support traders who want to simplify technical chart analysis and discover potential setups without constantly switching between individual charts.
How Does Automated Chart Scanning Save Time?
Manual chart analysis can take a significant amount of time. Traders may need to open multiple charts, change timeframes, inspect price movements, and look for patterns one by one. This process becomes even more demanding when markets move quickly.
Automated scanning handles much of this repetitive work. A scanner can review multiple charts according to selected conditions and highlight instruments that meet those requirements. Instead of spending hours searching, traders can begin their analysis with a more focused list of charts.
This time-saving benefit can be especially useful for traders who monitor several markets simultaneously.
How Does a Chart Pattern Scanner Identify Opportunities?
A Chart pattern scanner uses predefined rules to search for recognizable technical formations. Depending on the software, it may identify patterns such as triangles, channels, flags, wedges, breakouts, or other price structures.
The scanner does not need to interpret every chart manually. Instead, it compares market data with the conditions programmed into the tool. When a chart matches those conditions, the scanner can display or alert the trader to the potential setup.
This process helps traders organize their research. However, a detected pattern does not guarantee that a trade will succeed. Traders should still review price action, market conditions, risk, and other relevant factors before making decisions.
Can Automated Scanning Monitor Multiple Markets?
One of the biggest benefits of automated scanning is its ability to monitor multiple markets at once. A Chart scanner for multiple markets can help traders examine different asset classes without opening every chart individually.
For example, a trader may want to monitor:
- Major forex pairs
- Cryptocurrency pairs
- Stock markets
- Indexes
- Commodities
- Different trading timeframes
Instead of checking each instrument manually, the scanner can process selected markets and present matching results in one place.
This broader market coverage can help traders avoid limiting their analysis to a small number of familiar assets.
How Does Automated Scanning Reduce Repetitive Analysis?
Chart analysis often involves repetitive tasks. Traders may repeatedly check support and resistance areas, price formations, trend structures, and other technical conditions.
Automated scanning can handle these repetitive searches consistently. Once traders define their preferred conditions, the software can apply them across multiple charts.
This does not eliminate the need for human analysis. Instead, it allows traders to spend more time evaluating the information that matters and less time performing routine searches.
Does Automated Scanning Improve Consistency?
Consistency is another important benefit. When traders manually scan charts, fatigue, distractions, or time pressure can affect the process. A scanner applies programmed criteria in the same way each time.
For example, if a trader wants to search for a particular chart structure across several markets, automated software can use the same scanning conditions for every selected instrument.
This creates a more structured research process. Traders can also adjust their scanning rules as their technical approach develops.
However, consistency in scanning does not automatically create profitable results. The quality of the rules and the trader’s interpretation remain important.
How Can Scanners Help Traders Find Patterns Faster?
Financial markets can contain thousands of individual price charts. Finding a specific formation manually can become difficult when traders monitor a large watchlist.
A Chart pattern scanner can narrow that large group by identifying charts that meet selected technical conditions. This makes it easier to investigate potential patterns without reviewing every instrument from scratch.
For example, a trader searching for breakout structures can use scanning criteria to identify charts showing relevant characteristics. The trader can then inspect those charts manually before considering any further action.
The scanner therefore works as a research filter rather than a replacement for human judgment.
Can Automated Chart Scanning Support Different Timeframes?
Many traders use several timeframes during technical analysis. A short-term trader may examine smaller intervals, while a longer-term trader may focus on daily or weekly charts.
Automated scanners can make multi-timeframe research more efficient by allowing users to scan selected intervals. This can help traders compare short-term and longer-term price structures.
For example, a pattern appearing on a four-hour chart may look different from the structure visible on a daily chart. Reviewing multiple timeframes can provide additional context before a trader evaluates a setup.
How Can Alerts Improve Market Monitoring?
Some automated scanning tools provide alerts when selected conditions appear. Alerts can notify traders when a chart matches predefined criteria.
This feature can reduce the need to constantly watch screens. Traders can continue other tasks while the scanner monitors the selected markets.
Alerts may be based on pattern detection, price movements, technical levels, or other conditions supported by the software. Traders should configure alerts carefully so they receive useful information rather than excessive notifications.
How Does Automated Scanning Help With Market Research?
Automated scanning can also improve the organization of market research. Instead of keeping a large watchlist and manually checking every instrument, traders can create focused lists based on specific technical conditions.
For instance, one scan may search for emerging patterns, while another may focus on trend continuation structures. This allows traders to separate their research into different categories.
Fibonacci Scanner can be used as part of a structured technical-analysis workflow where traders want to examine chart-based signals more efficiently.
What Are the Limitations of Automated Chart Scanning?
Automated scanning offers convenience, but it has limitations. A scanner follows rules and data. It does not understand every aspect of market behavior or broader economic conditions.
A detected pattern may fail because of sudden volatility, news events, liquidity changes, or other market factors. Technical patterns can also produce false signals.
For this reason, traders should treat scanner results as research information rather than guaranteed trading signals. They should review each setup independently and apply appropriate risk-management practices.
How Can Traders Use Automated Scanning More Effectively?
Traders can get more value from automated scanning by defining clear criteria before starting a scan. They should decide which markets, timeframes, patterns, and technical conditions matter to their strategy.
It also helps to avoid scanning too many conditions at once. A simple and focused approach can make results easier to understand.
Traders should also review detected charts manually. A scanner can identify potential setups, but the final analysis should consider the broader market context, price behavior, and individual trading objectives.
Why Is Automated Chart Scanning Becoming Important?
Modern financial markets move continuously, and traders often have more information available than they can realistically review manually. Automated scanning addresses this challenge by filtering large amounts of chart data according to predefined conditions.
The main benefits include faster market research, broader market coverage, reduced repetitive work, consistent scanning, customizable criteria, and potential alerts.
A Chart scanner for multiple markets can therefore become a useful part of a trader’s research process. Combined with a reliable Chart pattern scanner, it can help traders locate charts that deserve closer attention.
Ultimately, automated scanning should support—not replace—human analysis. When traders combine scanning technology with disciplined research and risk management, they can create a more organized approach to monitoring financial markets.




recent post

What Are the Benefits of Practising Core Pilates in Houston?
October 12, 2026

What Makes an Ayurvedic Clinic in Sydney the Right Choice for You?
October 12, 2026

Which Luxurious Shower Systems Are Best for Contemporary Bathrooms?
October 12, 2026

Why Should You Hire Experts for Biohazard Cleanup?
October 12, 2026
CONTACT US

Category
MUST READ

Popular Posts